Bisnis di South Valley
Industri
Distribusi Bisnis berdasarkan Industri Layanan Rumah: 28,6%
Belanja: 14,3%
Layanan Setempat: 14,3%
Medis: 7,1%
Industri: 7,1%
Otomotif: 7,1%
Kecantikan & Spa: 7,1%
Layanan Profesional: 7,1%
Komunitas & Pemerintah: 7,1%
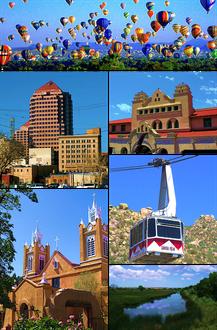
| Area South Valley, New Mexico | 30,08 mi² |
| Populasi | 45.080 |
| Populasi Pria | 22.376 (49,6%) |
| Populasi Wanita | 22.704 (50,4%) |
| Populasi berubah dari 1975 hingga 2015 | +97,6% |
| Populasi berubah dari 2000 hingga 2015 | +28% |
| Usia Rata-rata | 35,3 |
| Usia Rata-rata Pria | 34,6 |
| Usia Rata-rata Wanita | 36 |
| Sekitarnya | Mountain View, Valley Growers, Vivian Place |
| Waktu Setempat | Kamis 19.01 |
| Zona Waktu | Waktu Musim Panas Pegunungan |
| Grs Lintang & Grs Bujur | 35.01005° / -106.67808° |
| Kode Pos | 87195 |
South Valley, New Mexico - Peta
Populasi South Valley, New Mexico
Tahun 1975 hingga 2015| Data | 1975 | 1990 | 2000 | 2015 |
|---|---|---|---|---|
| Populasi | 22.818 | 29.046 | 35.205 | 45.080 |
| Kepadatan penduduk | 758,6 / mi² | 965,7 / mi² | 1.170 / mi² | 1.498 / mi² |
Populasi South Valley berubah dari 2000 hingga 2015
Peningkatan 28% dari tahun 2000 hingga 2015| Lokasi | Berubah sejak 1975 | Berubah sejak 1990 | Berubah sejak 2000 |
|---|---|---|---|
| South Valley, New Mexico | +97,6% | +55,2% | +28% |
| New Mexico | +67,8% | +37,8% | +19% |
| Amerika Serikat | +46,9% | +27,2% | +13,7% |
Usia Median South Valley, New Mexico
Usia Median: 35,3 tahun| Lokasi | Usia Rata-rata | Usia Median (Wanita) | Usia rata-rata (Pria) |
|---|---|---|---|
| South Valley, New Mexico | 35,3 tahun | 36 tahun | 34,6 tahun |
| New Mexico | 36,7 tahun | 37,9 tahun | 35,4 tahun |
| Amerika Serikat | 37,4 tahun | 38,7 tahun | 36,1 tahun |
Pohon Populasi South Valley, New Mexico
Penduduk Menurut Umur dan Jenis Kelamin| Usia | Pria | Wanita | Total |
|---|---|---|---|
| Di bawah 5 | 1.703 | 1.593 | 3.297 |
| 5-9 | 1.678 | 1.713 | 3.391 |
| 10-14 | 1.695 | 1.667 | 3.362 |
| 15-19 | 1.766 | 1.695 | 3.462 |
| 20-24 | 1.569 | 1.565 | 3.135 |
| 25-29 | 1.496 | 1.527 | 3.023 |
| 30-34 | 1.403 | 1.334 | 2.737 |
| 35-39 | 1.350 | 1.344 | 2.695 |
| 40-44 | 1.445 | 1.379 | 2.825 |
| 45-49 | 1.716 | 1.594 | 3.311 |
| 50-54 | 1.552 | 1.639 | 3.191 |
| 55-59 | 1.358 | 1.357 | 2.716 |
| 60-64 | 1.219 | 1.243 | 2.462 |
| 65-69 | 795 | 922 | 1.718 |
| 70-74 | 669 | 769 | 1.439 |
| 75-79 | 472 | 564 | 1.037 |
| 80-84 | 296 | 426 | 722 |
| 85 Plus | 193 | 372 | 566 |
Kepadatan Populasi South Valley, New Mexico
Kepadatan Populasi: 1.498 / mi²| Lokasi | Populasi | Area | Kepadatan penduduk |
|---|---|---|---|
| South Valley, New Mexico | 45.080 | 30,08 mi² | 1.498 / mi² |
| New Mexico | 2,2 juta | 121.591,1 mi² | 17,9 / mi² |
| Amerika Serikat | 321,6 juta | 3.796.761,2 mi² | 84,7 / mi² |
Proyeksi dan Sejarah Populasi South Valley, New Mexico
Perkiraan Populasi dari 1870 hingga 2100Sources:
1. JRC (European Commission's Joint Research Centre) work on the GHS built-up grid
2. CIESIN (Center for International Earth Science Information Network)
3. [Link] Klein Goldewijk, K., Beusen, A., Doelman, J., and Stehfest, E.: Anthropogenic land use estimates for the Holocene – HYDE 3.2, Earth Syst. Sci. Data, 9, 927–953, https://doi.org/10.5194/essd-9-927-2017, 2017.
Sekitarnya
Distribusi Bisnis berdasarkan lingkungan di South Valley Mountain View: 25%
Vivian Place: 10,7%
Valley Growers: 10,7%
Kirtland Air Force Base: 7,1%
Afc: 3,6%
Waldie: 3,6%
Stanton: 3,6%
San Jose: 3,6%
Adobe Acres: 3,6%
El Porvenir: 3,6%
Valle Verde: 3,6%
Cherry Acres: 3,6%
South Atrisco: 3,6%
Orchard Gardens: 3,6%
Cottonwood Place: 3,6%
Westgate Heights: 3,6%
Vecinos Del Bosque: 3,6%
Kode Area
Persentase Kode Area yang digunakan oleh bisnis dalam South Valley Kode Area 505: 86,7%
Kode Area 304: 6,7%
Kode Area 315: 6,7%
Indeks Pembangunan Manusia (IPM)
Indeks komposit statistik dari harapan hidup, pendidikan, dan pendapatan per kapita.Sources: [Link] Kummu, M., Taka, M. & Guillaume, J. Gridded global datasets for Gross Domestic Product and Human Development Index over 1990–2015. Sci Data 5, 180004 (2018) doi:10.1038/sdata.2018.4
Emisi CO2 South Valley, New Mexico
Emisi Karbon Dioksida (CO2) Per Kapita dalam Ton Per Tahun| Lokasi | Emisi CO2 | Emisi CO2 Per Kapita | Intensitas Emisi CO2 |
|---|---|---|---|
| South Valley, New Mexico | 648.519 tn AS | 14,4 tn AS | 21.561 ton AS/mi² |
| New Mexico | 37.040.392 tn AS | 17 tn AS | 304,6 ton AS/mi² |
| Amerika Serikat | 5.664.619.809 tn AS | 17,6 tn AS | 1.491 ton AS/mi² |
Emisi CO2 South Valley, New Mexico
| Emisi CO2 2013 (ton/tahun) | 648.519 tn AS |
| Emisi CO@ 2013 (ton/tahun) per kapita | 14,4 tn AS |
| Intensitas emisi CO2 2013 (ton/mi²/tahun) |
Risiko Bencana Alam
Risiko relatif dari 10| Kekeringan | (9) Tinggi |
| Gempa bumi | (4) Sedang |
* Risiko, terutama yang menyangkut banjir atau tanah longsor, mungkin tidak untuk seluruh area.
Sources: 1. Dilley, M., R.S. Chen, U. Deichmann, A.L. Lerner-Lam, M. Arnold, J. Agwe, P. Buys, O. Kjekstad, B. Lyon, and G. Yetman. 2005. Natural Disaster Hotspots: A Global Risk Analysis. Washington, D.C.: World Bank. https://doi.org/10.1596/0-8213-5930-4.
2. Center for Hazards and Risk Research - CHRR - Columbia University, Center for International Earth Science Information Network - CIESIN - Columbia University. 2005. Global Earthquake Hazard Distribution - Peak Ground Acceleration. Palisades, NY: NASA Socioeconomic Data and Applications Center (SEDAC). https://doi.org/10.7927/H4BZ63ZS.
3. Center for Hazards and Risk Research - CHRR - Columbia University, Center for International Earth Science Information Network - CIESIN - Columbia University, and International Research Institute for Climate and Society - IRI - Columbia University. 2005. Global Drought Hazard Frequency and Distribution. Palisades, NY: NASA Socioeconomic Data and Applications Center (SEDAC). https://doi.org/10.7927/H4VX0DFT.
Gempa Bumi Terdekat Terdekat
Magnitude 3.0 dan lebih tinggi| Tanggal | Waktu | Besarnya | Jarak | Kedalaman | Lokasi | Link |
|---|---|---|---|---|---|---|
| 01/12/17 | 09.12 | 3,8 | 80 km | 7.030 m | 27km NNE of Socorro, New Mexico | usgs.gov |
| 20/10/16 | 06.28 | 3,5 | 70,8 km | 5.000 m | 22km N of Laguna, New Mexico | usgs.gov |
| 16/09/15 | 12.34 | 3,2 | 80,8 km | 5.860 m | 27km NNE of Socorro, New Mexico | usgs.gov |
| 26/01/13 | 19.17 | 3,1 | 77,3 km | 5.000 m | 30km NNE of Socorro, New Mexico | usgs.gov |
| 28/09/12 | 17.59 | 3,5 | 38,8 km | 5.000 m | New Mexico | usgs.gov |
| 06/04/11 | 16.38 | 3,2 | 74,2 km | 5.000 m | New Mexico | usgs.gov |
| 24/05/04 | 14.36 | 3,5 | 63,8 km | 5.000 m | New Mexico | usgs.gov |
| 04/01/98 | 00.05 | 3,6 | 67,5 km | 5.000 m | New Mexico | usgs.gov |
| 31/12/97 | 05.33 | 3,4 | 70,3 km | 5.000 m | New Mexico | usgs.gov |
| 31/12/97 | 05.32 | 3,5 | 70,3 km | 5.000 m | New Mexico | usgs.gov |
Temukan gempa bersejarah yang terjadi di dekat South Valley, New Mexico
Tanggal Terlambat Kencan terakhir
Magnitude 3.0 dan lebih tinggi Besarnya 4.0 dan lebih besar Besarnya 5,0 dan lebih besar
Kode Pos
Persentase bisnis oleh Kode Pos di South Valley Kode Pos 87105: 73,7%
Kode Pos 87121: 15,8%
Kode Pos 87117: 5,3%
Kode Pos 87111: 2,6%
Kode Pos 87144: 2,6%
Tentang Data Kami
Data pada halaman ini diperkirakan menggunakan sejumlah alat dan sumber daya yang tersedia untuk umum. Ini diberikan tanpa jaminan, dan dapat mengandung ketidakakuratan. Gunakan dengan risiko Anda sendiri. Lihat di sini untuk informasi lebih lanjut.