- Dunia
- »
- US
- »
- New York
- »
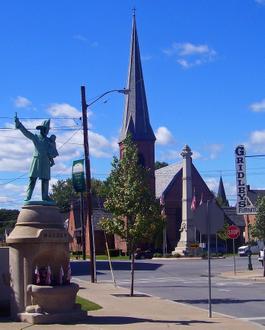
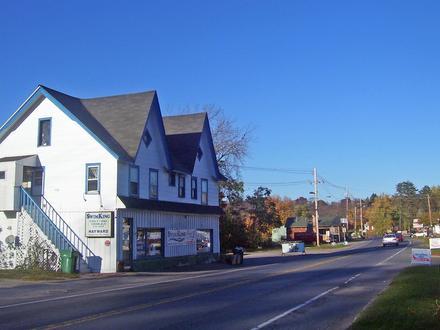
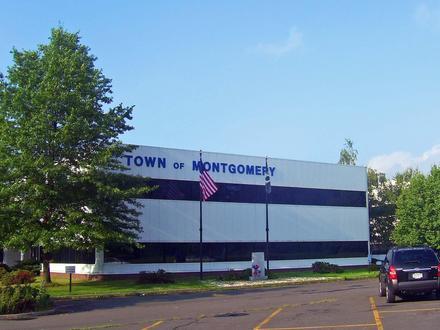
- Ellenville, New York
Bisnis di Ellenville
Hotel & Wisata
Restoran
Otomotif
Layanan Keuangan
Medis
Kecantikan & Spa
Komunitas & Pemerintah
Industri
Distribusi Bisnis berdasarkan Industri Belanja: 13,2%
Medis: 12,8%
Layanan Profesional: 10%
Industri: 8,8%
Otomotif: 8,3%
Restoran: 7,7%
Layanan Rumah: 6,1%
Agama: 5,1%
Lainnya: 28%
| Deskripsi Industri | Jumlah Perusahaan | Rata-rata Usia Bisnis | Peringkat Google Rata-rata | Bisnis per 1.000 penduduk |
|---|---|---|---|---|
| Perbaikan mobil | 19 | 41,6 tahun | 4.3 | 4,7 |
| Pompa bensin | 10 | 47,2 tahun | 4.1 | 2,4 |
| Penata rambut | 5 | 4.5 | 1,2 | |
| Salon kecantikan | 6 | 33 tahun | 4.6 | 1,5 |
| Administrasi Publik | 10 | 35,3 tahun | 3.6 | 2,4 |
| Pekerjaan sosial | 10 | 31,7 tahun | 4.5 | 2,4 |
| Pendidikan menengah | 5 | 2.7 | 1,2 | |
| Bank | 9 | 116,5 tahun | 3.9 | 2,2 |
| Keuangan lainnya | 9 | 93,5 tahun | 4.6 | 2,2 |
| Toko | 6 | 4.1 | 1,5 | |
| Toko Roti | 6 | 4.1 | 1,5 | |
| Toko bahan makanan dan supermarket | 9 | 44,3 tahun | 4.1 | 2,2 |
| Instalasi dan perbaikan pipa | 6 | 37,1 tahun | 5.0 | 1,5 |
| Konstruksi lainnya | 8 | 42,9 tahun | 3.7 | 2,0 |
| Kontraktor Umum | 17 | 37,5 tahun | 4.4 | 4,2 |
| Real Estate | 13 | 36,2 tahun | 3.5 | 3,2 |
| Akomodasi lainnya | 9 | 40,3 tahun | 4.0 | 2,2 |
| Hotel dan motel | 6 | 38,9 tahun | 3.9 | 1,5 |
| Rumah liburan, kabin dan resort | 5 | 30,7 tahun | 4.3 | 1,2 |
| Keanggotaan Organisasi Lainnya | 5 | 3.5 | 1,2 | |
| Konstruksi bangunan | 5 | 32,7 tahun | 5.0 | 1,2 |
| Dokter dan Ahli Bedah | 28 | 28,4 tahun | 3.6 | 6,9 |
| Dokter gigi | 5 | 3.0 | 1,2 | |
| Kesehatan dan medis | 61 | 36,5 tahun | 4.0 | 14,9 |
| Kiropraktor | 6 | 4.7 | 1,5 | |
| Psikiater dan psikoterapis | 5 | 37,1 tahun | 2.5 | 1,2 |
| Rumah Sakit | 7 | 54,5 tahun | 3.1 | 1,7 |
| Akuntan | 8 | 37,7 tahun | 3.0 | 2,0 |
| Pengacara legal | 8 | 30,4 tahun | 2.2 | 2,0 |
| Periklanan dan Pemasaran | 5 | 40,1 tahun | 4.8 | 1,2 |
| Gereja | 22 | 53,8 tahun | 4.5 | 5,4 |
| Rumah ibadat | 5 | 5.0 | 1,2 | |
| Kedai, bar dan warung | 5 | 4.1 | 1,2 | |
| Rumah makan Italia | 6 | 4.3 | 1,5 | |
| Toko pakaian | 7 | 52,1 tahun | 3.0 | 1,7 |
| Area Ellenville, New York | 8,76 mi² |
| Populasi | 4.083 |
| Populasi Pria | 1.991 (48,8%) |
| Populasi Wanita | 2.092 (51,2%) |
| Populasi berubah dari 1975 hingga 2015 | +2% |
| Populasi berubah dari 2000 hingga 2015 | +2,5% |
| Usia Rata-rata | 35,6 |
| Usia Rata-rata Pria | 34,6 |
| Usia Rata-rata Wanita | 36,6 |
| Kode Area | 845 |
| Sekitarnya | Ellenville |
| Waktu Setempat | Kamis 14.37 |
| Zona Waktu | Waktu Musim Panas Timur |
| Grs Lintang & Grs Bujur | 41.71704° / -74.39571° |
| Kode Pos | 12428 |
Ellenville, New York - Peta
Populasi Ellenville, New York
Tahun 1975 hingga 2015| Data | 1975 | 1990 | 2000 | 2015 |
|---|---|---|---|---|
| Populasi | 4.003 | 3.840 | 3.982 | 4.083 |
| Kepadatan penduduk | 456,7 / mi² | 438,1 / mi² | 454,3 / mi² | 465,9 / mi² |
Populasi Ellenville berubah dari 2000 hingga 2015
Peningkatan 2,5% dari tahun 2000 hingga 2015| Lokasi | Berubah sejak 1975 | Berubah sejak 1990 | Berubah sejak 2000 |
|---|---|---|---|
| Ellenville, New York | +2% | +6,3% | +2,5% |
| New York | +15,2% | +7,1% | +1,6% |
| Amerika Serikat | +46,9% | +27,2% | +13,7% |
Usia Median Ellenville, New York
Usia Median: 35,6 tahun| Lokasi | Usia Rata-rata | Usia Median (Wanita) | Usia rata-rata (Pria) |
|---|---|---|---|
| Ellenville, New York | 35,6 tahun | 36,6 tahun | 34,6 tahun |
| New York | 38,1 tahun | 39,6 tahun | 36,6 tahun |
| Amerika Serikat | 37,4 tahun | 38,7 tahun | 36,1 tahun |
Pohon Populasi Ellenville, New York
Penduduk Menurut Umur dan Jenis Kelamin| Usia | Pria | Wanita | Total |
|---|---|---|---|
| Di bawah 5 | 153 | 158 | 311 |
| 5-9 | 173 | 168 | 342 |
| 10-14 | 162 | 141 | 303 |
| 15-19 | 152 | 142 | 294 |
| 20-24 | 109 | 114 | 224 |
| 25-29 | 131 | 137 | 269 |
| 30-34 | 125 | 138 | 264 |
| 35-39 | 105 | 142 | 247 |
| 40-44 | 141 | 145 | 286 |
| 45-49 | 150 | 152 | 303 |
| 50-54 | 145 | 130 | 275 |
| 55-59 | 122 | 125 | 247 |
| 60-64 | 113 | 119 | 232 |
| 65-69 | 83 | 90 | 173 |
| 70-74 | 57 | 65 | 123 |
| 75-79 | 26 | 46 | 72 |
| 80-84 | 27 | 40 | 67 |
| 85 Plus | 19 | 39 | 59 |
Kepadatan Populasi Ellenville, New York
Kepadatan Populasi: 465,9 / mi²| Lokasi | Populasi | Area | Kepadatan penduduk |
|---|---|---|---|
| Ellenville, New York | 4.083 | 8,76 mi² | 465,9 / mi² |
| New York | 19,4 juta | 54.555,3 mi² | 355,2 / mi² |
| Amerika Serikat | 321,6 juta | 3.796.761,2 mi² | 84,7 / mi² |
Proyeksi dan Sejarah Populasi Ellenville, New York
Perkiraan Populasi dari 1780 hingga 2100Sources:
1. JRC (European Commission's Joint Research Centre) work on the GHS built-up grid
2. CIESIN (Center for International Earth Science Information Network)
3. [Link] Klein Goldewijk, K., Beusen, A., Doelman, J., and Stehfest, E.: Anthropogenic land use estimates for the Holocene – HYDE 3.2, Earth Syst. Sci. Data, 9, 927–953, https://doi.org/10.5194/essd-9-927-2017, 2017.
Distribusi bisnis berdasarkan harga untuk Ellenville, New York
Menengah: 55,8%
Tidak mahal: 34,9%
Mahal: 7%
Sangat Mahal: 2,3%
Indeks Pembangunan Manusia (IPM)
Indeks komposit statistik dari harapan hidup, pendidikan, dan pendapatan per kapita.Sources: [Link] Kummu, M., Taka, M. & Guillaume, J. Gridded global datasets for Gross Domestic Product and Human Development Index over 1990–2015. Sci Data 5, 180004 (2018) doi:10.1038/sdata.2018.4
Emisi CO2 Ellenville, New York
Emisi Karbon Dioksida (CO2) Per Kapita dalam Ton Per Tahun| Lokasi | Emisi CO2 | Emisi CO2 Per Kapita | Intensitas Emisi CO2 |
|---|---|---|---|
| Ellenville, New York | 62.210 tn AS | 15,2 tn AS | 7.097 ton AS/mi² |
| New York | 334.299.374 tn AS | 17,3 tn AS | 6.127 ton AS/mi² |
| Amerika Serikat | 5.664.619.809 tn AS | 17,6 tn AS | 1.491 ton AS/mi² |
Emisi CO2 Ellenville, New York
| Emisi CO2 2013 (ton/tahun) | 62.210 tn AS |
| Emisi CO@ 2013 (ton/tahun) per kapita | 15,2 tn AS |
| Intensitas emisi CO2 2013 (ton/mi²/tahun) |
Risiko Bencana Alam
Risiko relatif dari 10| Banjir | (4) Sedang |
| Gempa bumi | (2) Rendah |
* Risiko, terutama yang menyangkut banjir atau tanah longsor, mungkin tidak untuk seluruh area.
Sources: 1. Dilley, M., R.S. Chen, U. Deichmann, A.L. Lerner-Lam, M. Arnold, J. Agwe, P. Buys, O. Kjekstad, B. Lyon, and G. Yetman. 2005. Natural Disaster Hotspots: A Global Risk Analysis. Washington, D.C.: World Bank. https://doi.org/10.1596/0-8213-5930-4.
2. Center for Hazards and Risk Research - CHRR - Columbia University, Center for International Earth Science Information Network - CIESIN - Columbia University. 2005. Global Earthquake Hazard Distribution - Peak Ground Acceleration. Palisades, NY: NASA Socioeconomic Data and Applications Center (SEDAC). https://doi.org/10.7927/H4BZ63ZS.
3. Center for Hazards and Risk Research - CHRR - Columbia University, Center for International Earth Science Information Network - CIESIN - Columbia University. 2005. Global Flood Hazard Frequency and Distribution. Palisades, NY: NASA Socioeconomic Data and Applications Center (SEDAC). https://doi.org/10.7927/H4668B3D.
Gempa Bumi Terdekat Terdekat
Magnitude 3.0 dan lebih tinggi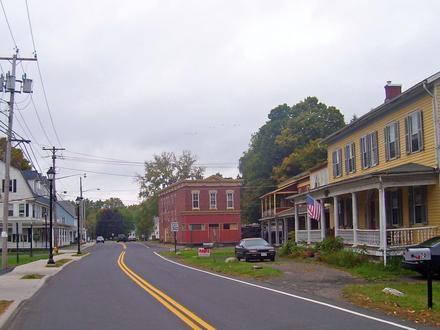
Tentang Data Kami
Data pada halaman ini diperkirakan menggunakan sejumlah alat dan sumber daya yang tersedia untuk umum. Ini diberikan tanpa jaminan, dan dapat mengandung ketidakakuratan. Gunakan dengan risiko Anda sendiri. Lihat di sini untuk informasi lebih lanjut.