- Dunia
- »
- US
- »
- New Jersey
- »
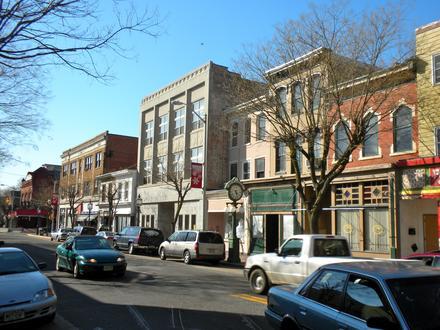
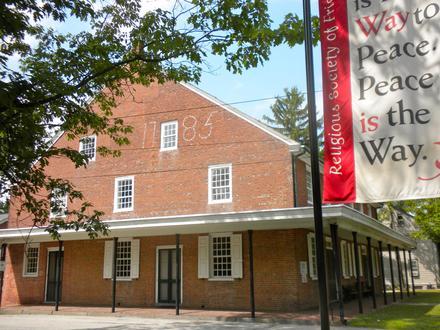
- Alloway, New Jersey
Bisnis di Alloway
Industri
Distribusi Bisnis berdasarkan Industri Belanja: 13%
Pendidikan: 13%
Komunitas & Pemerintah: 12,2%
Layanan Profesional: 11,3%
Industri: 10,4%
Restoran: 8,7%
Medis: 7%
Agama: 5,2%
Layanan Keuangan: 4,3%
Lainnya: 14,8%
| Area Alloway, New Jersey | 7,12 mi² |
| Populasi | 1.406 |
| Populasi Pria | 692 (49,2%) |
| Populasi Wanita | 714 (50,8%) |
| Populasi berubah dari 1975 hingga 2015 | +42,6% |
| Populasi berubah dari 2000 hingga 2015 | +2,6% |
| Usia Rata-rata | 41,7 |
| Usia Rata-rata Pria | 41,1 |
| Usia Rata-rata Wanita | 42,2 |
| Kode Area | 856 |
| Sekitarnya | Alloway |
| Waktu Setempat | Kamis 07.43 |
| Zona Waktu | Waktu Musim Panas Timur |
| Grs Lintang & Grs Bujur | 39.56095° / -75.36242° |
| Kode Pos | 08001 |
Alloway, New Jersey - Peta
Populasi Alloway, New Jersey
Tahun 1975 hingga 2015| Data | 1975 | 1990 | 2000 | 2015 |
|---|---|---|---|---|
| Populasi | 986 | 1.145 | 1.370 | 1.406 |
| Kepadatan penduduk | 138,5 / mi² | 160,8 / mi² | 192,4 / mi² | 197,4 / mi² |
Populasi Alloway berubah dari 2000 hingga 2015
Peningkatan 2,6% dari tahun 2000 hingga 2015| Lokasi | Berubah sejak 1975 | Berubah sejak 1990 | Berubah sejak 2000 |
|---|---|---|---|
| Alloway, New Jersey | +42,6% | +22,8% | +2,6% |
| New Jersey | +26% | +13,4% | +5,2% |
| Amerika Serikat | +46,9% | +27,2% | +13,7% |
Usia Median Alloway, New Jersey
Usia Median: 41,7 tahun| Lokasi | Usia Rata-rata | Usia Median (Wanita) | Usia rata-rata (Pria) |
|---|---|---|---|
| Alloway, New Jersey | 41,7 tahun | 42,2 tahun | 41,1 tahun |
| New Jersey | 38,9 tahun | 40,4 tahun | 37,4 tahun |
| Amerika Serikat | 37,4 tahun | 38,7 tahun | 36,1 tahun |
Pohon Populasi Alloway, New Jersey
Penduduk Menurut Umur dan Jenis Kelamin| Usia | Pria | Wanita | Total |
|---|---|---|---|
| Di bawah 5 | 33 | 30 | 63 |
| 5-9 | 45 | 49 | 94 |
| 10-14 | 54 | 52 | 107 |
| 15-19 | 48 | 56 | 104 |
| 20-24 | 43 | 40 | 84 |
| 25-29 | 33 | 38 | 71 |
| 30-34 | 32 | 25 | 58 |
| 35-39 | 49 | 46 | 96 |
| 40-44 | 43 | 46 | 90 |
| 45-49 | 62 | 68 | 131 |
| 50-54 | 54 | 69 | 124 |
| 55-59 | 54 | 60 | 114 |
| 60-64 | 45 | 44 | 90 |
| 65-69 | 37 | 29 | 67 |
| 70-74 | 26 | 14 | 41 |
| 75-79 | 15 | 21 | 37 |
| 80-84 | 10 | 13 | 24 |
| 85 Plus | 9 | 12 | 21 |
Kepadatan Populasi Alloway, New Jersey
Kepadatan Populasi: 197,4 / mi²| Lokasi | Populasi | Area | Kepadatan penduduk |
|---|---|---|---|
| Alloway, New Jersey | 1.406 | 7,12 mi² | 197,4 / mi² |
| New Jersey | 8,9 juta | 8.722,6 mi² | 1.019 / mi² |
| Amerika Serikat | 321,6 juta | 3.796.761,2 mi² | 84,7 / mi² |
Proyeksi Populasi Alloway, New Jersey
Perkiraan Populasi dari 1975 hingga 2100Sources:
1. JRC (European Commission's Joint Research Centre) work on the GHS built-up grid
2. CIESIN (Center for International Earth Science Information Network)
3. [Link] Klein Goldewijk, K., Beusen, A., Doelman, J., and Stehfest, E.: Anthropogenic land use estimates for the Holocene – HYDE 3.2, Earth Syst. Sci. Data, 9, 927–953, https://doi.org/10.5194/essd-9-927-2017, 2017.
Indeks Pembangunan Manusia (IPM)
Indeks komposit statistik dari harapan hidup, pendidikan, dan pendapatan per kapita.Sources: [Link] Kummu, M., Taka, M. & Guillaume, J. Gridded global datasets for Gross Domestic Product and Human Development Index over 1990–2015. Sci Data 5, 180004 (2018) doi:10.1038/sdata.2018.4
Emisi CO2 Alloway, New Jersey
Emisi Karbon Dioksida (CO2) Per Kapita dalam Ton Per Tahun| Lokasi | Emisi CO2 | Emisi CO2 Per Kapita | Intensitas Emisi CO2 |
|---|---|---|---|
| Alloway, New Jersey | 26.156 tn AS | 18,6 tn AS | 3.672 ton AS/mi² |
| New Jersey | 148.066.841 tn AS | 16,6 tn AS | 16.975 ton AS/mi² |
| Amerika Serikat | 5.664.619.809 tn AS | 17,6 tn AS | 1.491 ton AS/mi² |
Emisi CO2 Alloway, New Jersey
| Emisi CO2 2013 (ton/tahun) | 26.156 tn AS |
| Emisi CO@ 2013 (ton/tahun) per kapita | 18,6 tn AS |
| Intensitas emisi CO2 2013 (ton/mi²/tahun) |
Risiko Bencana Alam
Risiko relatif dari 10| Topan | (7) Tinggi |
| Banjir | (9) Tinggi |
* Risiko, terutama yang menyangkut banjir atau tanah longsor, mungkin tidak untuk seluruh area.
Sources: 1. Dilley, M., R.S. Chen, U. Deichmann, A.L. Lerner-Lam, M. Arnold, J. Agwe, P. Buys, O. Kjekstad, B. Lyon, and G. Yetman. 2005. Natural Disaster Hotspots: A Global Risk Analysis. Washington, D.C.: World Bank. https://doi.org/10.1596/0-8213-5930-4.
2. Center for Hazards and Risk Research - CHRR - Columbia University, Center for International Earth Science Information Network - CIESIN - Columbia University, International Bank for Reconstruction and Development - The World Bank, and United Nations Environment Programme Global Resource Information Database Geneva - UNEP/GRID-Geneva. 2005. Global Cyclone Hazard Frequency and Distribution. Palisades, NY: NASA Socioeconomic Data and Applications Center (SEDAC). https://doi.org/10.7927/H4CZ353K.
3. Center for Hazards and Risk Research - CHRR - Columbia University, Center for International Earth Science Information Network - CIESIN - Columbia University. 2005. Global Flood Hazard Frequency and Distribution. Palisades, NY: NASA Socioeconomic Data and Applications Center (SEDAC). https://doi.org/10.7927/H4668B3D.
Gempa Bumi Terdekat Terdekat
Magnitude 3.0 dan lebih tinggi| Tanggal | Waktu | Besarnya | Jarak | Kedalaman | Lokasi | Link |
|---|---|---|---|---|---|---|
| 30/11/17 | 13.47 | 4,1 | 40,8 km | 9.870 m | 9km ENE of Dover, Delaware | usgs.gov |
| 22/10/90 | 18.34 | 3,2 | 13,5 km | 10.000 m | New Jersey | usgs.gov |
| 22/04/84 | 17.36 | 4,2 | 94 km | 5.000 m | Pennsylvania | usgs.gov |
| 10/03/80 | 22.00 | 3,7 | 69,6 km | 5.000 m | Greater Philadelphia area, Pennsylvania | usgs.gov |
| 05/03/80 | 09.06 | 3,5 | 71,8 km | 5.000 m | Greater Philadelphia area, Pennsylvania | usgs.gov |
| 15/07/78 | 23.39 | 3,1 | 87,2 km | 5.000 m | Pennsylvania | usgs.gov |
| 28/02/73 | 00.21 | 3,8 | 18,7 km | 14.000 m | New Jersey | usgs.gov |


Tentang Data Kami
Data pada halaman ini diperkirakan menggunakan sejumlah alat dan sumber daya yang tersedia untuk umum. Ini diberikan tanpa jaminan, dan dapat mengandung ketidakakuratan. Gunakan dengan risiko Anda sendiri. Lihat di sini untuk informasi lebih lanjut.