- Dunia
- »
- PH
- »
- Ilocos
- »
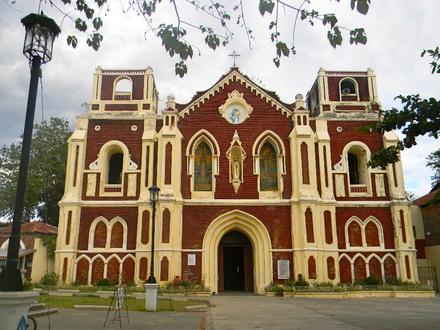
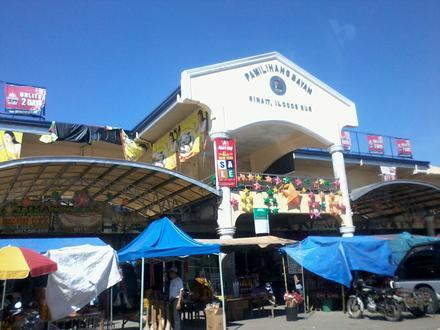
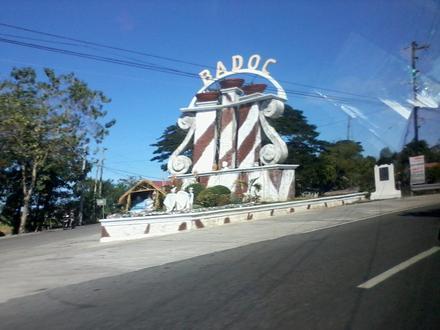
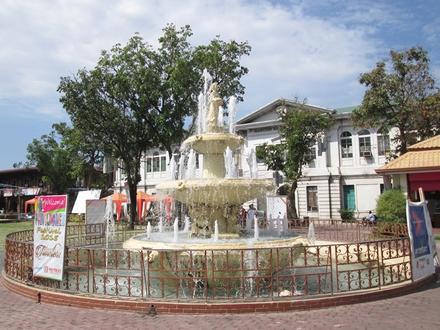
- Cabugao, Ilocos Sur
Bisnis di Cabugao, Ilocos Sur
Hotel & Wisata
Restoran
Otomotif
Layanan Keuangan
Medis
Kecantikan & Spa
Komunitas & Pemerintah
Industri
Distribusi Bisnis berdasarkan Industri Belanja: 17%
Pendidikan: 13,8%
Restoran: 10,7%
Makanan: 8,5%
Hotel & Wisata: 7,5%
Agama: 6,9%
Otomotif: 6,1%
Industri: 5,5%
Medis: 5,1%
Layanan Keuangan: 4,9%
Lainnya: 14,2%
| Deskripsi Industri | Jumlah Perusahaan | Peringkat Google Rata-rata | Bisnis per 1.000 penduduk |
|---|---|---|---|
| Sekolah dasar | 24 | 3.8 | 0,6 |
| Perusahaan Peminjaman | 6 | 0,2 | |
| Gereja | 6 | 5.0 | 0,2 |
| Area Cabugao, Ilocos Sur | 95,6 km² |
| Populasi | 37.987 |
| Populasi Pria | 19.204 (50,6%) |
| Populasi Wanita | 18.782 (49,4%) |
| Populasi berubah dari 1975 hingga 2015 | +425,6% |
| Populasi berubah dari 2000 hingga 2015 | +37,4% |
| Usia Rata-rata | 25,5 |
| Usia Rata-rata Pria | 24,8 |
| Usia Rata-rata Wanita | 26,2 |
| Kode Area | 77 |
| Waktu Setempat | Minggu 00.53 |
| Zona Waktu | Waktu Standar Filipina |
| Grs Lintang & Grs Bujur | 17.7931° / 120.4578° |
| Kode Pos | 2732 |
Cabugao, Ilocos Sur - Peta
Populasi Cabugao, Ilocos Sur
Tahun 1975 hingga 2015| Data | 1975 | 1990 | 2000 | 2015 |
|---|---|---|---|---|
| Populasi | 7.227 | 19.393 | 27.648 | 37.987 |
| Kepadatan penduduk | 75,6 / km² | 202,9 / km² | 289,3 / km² | 397,5 / km² |
Populasi Cabugao, Ilocos Sur berubah dari 2000 hingga 2015
Peningkatan 37,4% dari tahun 2000 hingga 2015| Lokasi | Berubah sejak 1975 | Berubah sejak 1990 | Berubah sejak 2000 |
|---|---|---|---|
| Cabugao, Ilocos Sur | +425,6% | +95,9% | +37,4% |
| Ilocos Sur | +313,5% | +75,7% | +28,4% |
| Filipina | +146,5% | +63,3% | +29,5% |
Usia Median Cabugao, Ilocos Sur
Usia Median: 25,5 tahun| Lokasi | Usia Rata-rata | Usia Median (Wanita) | Usia rata-rata (Pria) |
|---|---|---|---|
| Cabugao, Ilocos Sur | 25,5 tahun | 26,2 tahun | 24,8 tahun |
| Ilocos Sur | 26 tahun | 26,8 tahun | 25,3 tahun |
| Filipina | 23,2 tahun | 23,6 tahun | 22,8 tahun |
Pohon Populasi Cabugao, Ilocos Sur
Penduduk Menurut Umur dan Jenis Kelamin| Usia | Pria | Wanita | Total |
|---|---|---|---|
| Di bawah 5 | 1.975 | 1.890 | 3.866 |
| 5-9 | 2.050 | 1.878 | 3.928 |
| 10-14 | 1.968 | 1.789 | 3.757 |
| 15-19 | 1.929 | 1.795 | 3.725 |
| 20-24 | 1.766 | 1.663 | 3.429 |
| 25-29 | 1.633 | 1.562 | 3.195 |
| 30-34 | 1.530 | 1.419 | 2.949 |
| 35-39 | 1.300 | 1.206 | 2.507 |
| 40-44 | 1.168 | 1.128 | 2.296 |
| 45-49 | 1.093 | 1.060 | 2.154 |
| 50-54 | 869 | 838 | 1.708 |
| 55-59 | 634 | 745 | 1.379 |
| 60-64 | 493 | 588 | 1.081 |
| 65-69 | 370 | 478 | 849 |
| 70-74 | 244 | 429 | 673 |
| 75-79 | 181 | 316 | 498 |
| 80-84 | 0 | 0 | 0 |
| 85 Plus | 0 | 0 | 0 |
Kepadatan Populasi Cabugao, Ilocos Sur
Kepadatan Populasi: 397,5 / km²| Lokasi | Populasi | Area | Kepadatan penduduk |
|---|---|---|---|
| Cabugao, Ilocos Sur | 37.987 | 95,6 km² | 397,5 / km² |
| Ilocos Sur | 688.558 | 2.534,5 km² | 271,7 / km² |
| Filipina | 96,6 juta | 296.939,4 km² | 325,3 / km² |
Proyeksi dan Sejarah Populasi Cabugao, Ilocos Sur
Perkiraan Populasi dari 1890 hingga 2100Sources:
1. JRC (European Commission's Joint Research Centre) work on the GHS built-up grid
2. CIESIN (Center for International Earth Science Information Network)
3. [Link] Klein Goldewijk, K., Beusen, A., Doelman, J., and Stehfest, E.: Anthropogenic land use estimates for the Holocene – HYDE 3.2, Earth Syst. Sci. Data, 9, 927–953, https://doi.org/10.5194/essd-9-927-2017, 2017.
Kode Area
Persentase Kode Area yang digunakan oleh bisnis dalam Cabugao, Ilocos Sur Kode Area 77: 53,1%
Kode Area 917: 25%
Kode Area 2: 3,1%
Kode Area 75: 3,1%
Kode Area 905: 3,1%
Kode Area 907: 3,1%
Kode Area 915: 3,1%
Kode Area 916: 3,1%
Kode Area 928: 3,1%
Indeks Pembangunan Manusia (IPM)
Indeks komposit statistik dari harapan hidup, pendidikan, dan pendapatan per kapita.Sources: [Link] Kummu, M., Taka, M. & Guillaume, J. Gridded global datasets for Gross Domestic Product and Human Development Index over 1990–2015. Sci Data 5, 180004 (2018) doi:10.1038/sdata.2018.4
Emisi CO2 Cabugao, Ilocos Sur
Emisi Karbon Dioksida (CO2) Per Kapita dalam Ton Per Tahun| Lokasi | Emisi CO2 | Emisi CO2 Per Kapita | Intensitas Emisi CO2 |
|---|---|---|---|
| Cabugao, Ilocos Sur | 28.959 tn AS | 0,76 tn AS | 303,1 ton AS/km² |
| Ilocos Sur | 755.159 tn AS | 1,1 tn AS | 298 ton AS/km² |
| Filipina | 104.920.564 tn AS | 1,09 tn AS | 353,3 ton AS/km² |
Emisi CO2 Cabugao, Ilocos Sur
| Emisi CO2 2013 (ton/tahun) | 28.959 tn AS |
| Emisi CO@ 2013 (ton/tahun) per kapita | 0,76 tn AS |
| Intensitas Emisi CO2 2013 (ton/km²/tahun) | 303,1 ton AS/km² |
Risiko Bencana Alam
Risiko relatif dari 10| Tanah longsor | (9) Tinggi |
| Topan | (10) Tinggi |
| Gempa bumi | (8) Tinggi |
* Risiko, terutama yang menyangkut banjir atau tanah longsor, mungkin tidak untuk seluruh area.
Sources: 1. Dilley, M., R.S. Chen, U. Deichmann, A.L. Lerner-Lam, M. Arnold, J. Agwe, P. Buys, O. Kjekstad, B. Lyon, and G. Yetman. 2005. Natural Disaster Hotspots: A Global Risk Analysis. Washington, D.C.: World Bank. https://doi.org/10.1596/0-8213-5930-4.
2. Center for Hazards and Risk Research - CHRR - Columbia University, Center for International Earth Science Information Network - CIESIN - Columbia University. 2005. Global Earthquake Hazard Distribution - Peak Ground Acceleration. Palisades, NY: NASA Socioeconomic Data and Applications Center (SEDAC). https://doi.org/10.7927/H4BZ63ZS.
3. Center for Hazards and Risk Research - CHRR - Columbia University, Center for International Earth Science Information Network - CIESIN - Columbia University, and Norwegian Geotechnical Institute - NGI. 2005. Global Landslide Hazard Distribution. Palisades, NY: NASA Socioeconomic Data and Applications Center (SEDAC). https://doi.org/10.7927/H4P848VZ.
4. Center for Hazards and Risk Research - CHRR - Columbia University, Center for International Earth Science Information Network - CIESIN - Columbia University, International Bank for Reconstruction and Development - The World Bank, and United Nations Environment Programme Global Resource Information Database Geneva - UNEP/GRID-Geneva. 2005. Global Cyclone Hazard Frequency and Distribution. Palisades, NY: NASA Socioeconomic Data and Applications Center (SEDAC). https://doi.org/10.7927/H4CZ353K.
Gempa Bumi Terdekat Terdekat
Magnitude 3.0 dan lebih tinggi| Tanggal | Waktu | Besarnya | Jarak | Kedalaman | Lokasi | Link |
|---|---|---|---|---|---|---|
| 24/02/19 | 11.27 | 4,5 | 17,6 km | 37.320 m | 15km NNW of Puro Pingit, Philippines | usgs.gov |
| 12/01/19 | 05.20 | 4,7 | 32,8 km | 49.240 m | 2km ENE of Batac City, Philippines | usgs.gov |
| 25/11/18 | 01.21 | 4,7 | 27 km | 30.120 m | 4km SE of Nueva Era, Philippines | usgs.gov |
| 29/10/18 | 18.32 | 4,6 | 30,6 km | 35.000 m | 1km WSW of Callaguip, Philippines | usgs.gov |
| 27/09/18 | 17.03 | 4,3 | 33,2 km | 10.000 m | 13km SE of Nueva Era, Philippines | usgs.gov |
| 30/05/18 | 03.46 | 4,6 | 29,4 km | 52.710 m | 4km NW of Espiritu, Philippines | usgs.gov |
| 09/01/17 | 01.20 | 4,8 | 32,2 km | 36.860 m | 1km NNW of Batac City, Philippines | usgs.gov |
| 17/12/15 | 04.44 | 5,3 | 13,8 km | 69.650 m | 9km NW of Danglas, Philippines | usgs.gov |
| 05/07/15 | 06.12 | 4,8 | 24,1 km | 5.930 m | 7km S of Nueva Era, Philippines | usgs.gov |
| 05/07/15 | 05.56 | 5,2 | 31,1 km | 13.140 m | 3km ESE of Espiritu, Philippines | usgs.gov |
Temukan gempa bersejarah yang terjadi di dekat Cabugao, Ilocos Sur
Tanggal Terlambat Kencan terakhir
Magnitude 3.0 dan lebih tinggi Besarnya 4.0 dan lebih besar Besarnya 5,0 dan lebih besar

Cabugao, Ilocos Sur
Cabugao adalah munisipalitas yang terletak di provinsi Ilocos Sur, Filipina. tahun 2010, munisipalitas ini memiliki populasi sebesar 35.974 jiwa atau 7.194 rumah tangga. Laman Wikipedia Cabugao, Ilocos Sur
Tentang Data Kami
Data pada halaman ini diperkirakan menggunakan sejumlah alat dan sumber daya yang tersedia untuk umum. Ini diberikan tanpa jaminan, dan dapat mengandung ketidakakuratan. Gunakan dengan risiko Anda sendiri. Lihat di sini untuk informasi lebih lanjut.