Bisnis di Kishiwada
Hotel & Wisata
Restoran
Otomotif
Layanan Keuangan
Medis
Kecantikan & Spa
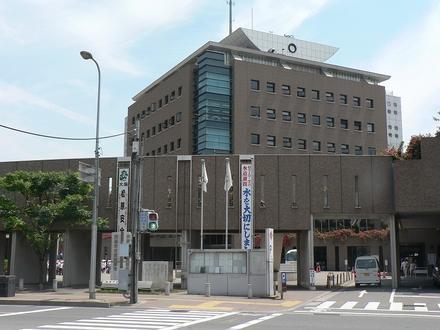
Komunitas & Pemerintah
Industri
Distribusi Bisnis berdasarkan Industri Belanja: 18,7%
Restoran: 12,2%
Industri: 11,7%
Layanan Rumah: 7,9%
Medis: 7,6%
Makanan: 6,6%
Layanan Profesional: 6%
Otomotif: 5,5%
Kecantikan & Spa: 5,2%
Lainnya: 18,4%
| Deskripsi Industri | Jumlah Perusahaan | Peringkat Google Rata-rata | Bisnis per 1.000 penduduk |
|---|---|---|---|
| Dealer Mobil Baru | 64 | 3.8 | 0,3 |
| Perbaikan mobil | 75 | 3.7 | 0,3 |
| Suku Cadang Mobil | 82 | 3.7 | 0,4 |
| Penata rambut | 201 | 3.9 | 0,9 |
| Salon kecantikan | 184 | 3.9 | 0,8 |
| Administrasi Publik | 116 | 3.3 | 0,5 |
| Perusahaan Peminjaman | 116 | 3.5 | 0,5 |
| Toko | 104 | 3.4 | 0,5 |
| Toko bahan makanan dan supermarket | 194 | 3.6 | 0,9 |
| Kontraktor Umum | 139 | 3.7 | 0,6 |
| Real Estate | 123 | 3.7 | 0,5 |
| Konstruksi bangunan | 70 | 3.5 | 0,3 |
| Dokter gigi | 105 | 3.4 | 0,5 |
| Kesehatan dan medis | 289 | 3.7 | 1,3 |
| Rumah Sakit | 84 | 3.4 | 0,4 |
| Kafetaria | 93 | 3.8 | 0,4 |
| Rumah makan Jepang | 162 | 3.6 | 0,7 |
| Farmasi dan toko obat | 131 | 3.5 | 0,6 |
| Area Kishiwada, Prefektur Osaka | 72,2 km² |
| Populasi | 227.322 |
| Populasi Pria | 109.287 (48,1%) |
| Populasi Wanita | 118.035 (51,9%) |
| Populasi berubah dari 1975 hingga 2015 | +7,4% |
| Populasi berubah dari 2000 hingga 2015 | +0,5% |
| Usia Rata-rata | 43,4 |
| Usia Rata-rata Pria | 41,9 |
| Usia Rata-rata Wanita | 44,7 |
| Kode Area | 724 |
| Sekitarnya | Habucho, Habucho, 2 Chome, Komatsuricho, Miyamotocho |
| Waktu Setempat | Jumat 20.19 |
| Zona Waktu | Waktu Standar Jepang |
| Grs Lintang & Grs Bujur | 34.46667° / 135.36667° |
| Kode Pos | 590, 592, 594, 595, 596, Selengkapnya |
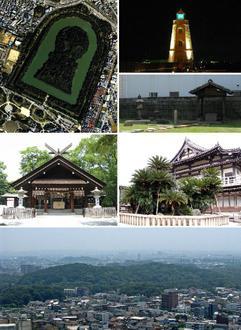
Kishiwada, Prefektur Osaka - Peta
Populasi Kishiwada, Prefektur Osaka
Tahun 1975 hingga 2015| Data | 1975 | 1990 | 2000 | 2015 |
|---|---|---|---|---|
| Populasi | 211.660 | 228.362 | 226.292 | 227.322 |
| Kepadatan penduduk | 2.929 / km² | 3.161 / km² | 3.132 / km² | 3.146 / km² |
Populasi Kishiwada berubah dari 2000 hingga 2015
Peningkatan 0,5% dari tahun 2000 hingga 2015| Lokasi | Berubah sejak 1975 | Berubah sejak 1990 | Berubah sejak 2000 |
|---|---|---|---|
| Kishiwada, Prefektur Osaka | +7,4% | -0,5% | +0,5% |
| Prefektur Osaka | +18,2% | +5,3% | +1,6% |
| Jepang | +13,6% | +3,4% | +0,6% |
Usia Median Kishiwada, Prefektur Osaka
Usia Median: 43,4 tahun| Lokasi | Usia Rata-rata | Usia Median (Wanita) | Usia rata-rata (Pria) |
|---|---|---|---|
| Kishiwada, Prefektur Osaka | 43,4 tahun | 44,7 tahun | 41,9 tahun |
| Prefektur Osaka | 44 tahun | 45,2 tahun | 42,7 tahun |
| Jepang | 45,2 tahun | 46,9 tahun | 43,5 tahun |
Pohon Populasi Kishiwada, Prefektur Osaka
Penduduk Menurut Umur dan Jenis Kelamin| Usia | Pria | Wanita | Total |
|---|---|---|---|
| Di bawah 5 | 5.286 | 5.118 | 10.405 |
| 5-9 | 6.025 | 5.673 | 11.699 |
| 10-14 | 6.587 | 6.095 | 12.682 |
| 15-19 | 6.177 | 5.825 | 12.002 |
| 20-24 | 5.863 | 5.736 | 11.599 |
| 25-29 | 6.004 | 6.226 | 12.231 |
| 30-34 | 6.814 | 7.091 | 13.905 |
| 35-39 | 8.799 | 9.354 | 18.154 |
| 40-44 | 8.155 | 8.391 | 16.547 |
| 45-49 | 7.092 | 7.410 | 14.502 |
| 50-54 | 6.041 | 6.320 | 12.361 |
| 55-59 | 6.878 | 7.394 | 14.272 |
| 60-64 | 8.427 | 9.026 | 17.453 |
| 65-69 | 7.226 | 8.022 | 15.249 |
| 70-74 | 5.847 | 6.755 | 12.602 |
| 75-79 | 4.261 | 5.630 | 9.891 |
| 80-84 | 2.499 | 4.144 | 6.643 |
| 85 Plus | 1.306 | 3.825 | 5.131 |
Kepadatan Populasi Kishiwada, Prefektur Osaka
Kepadatan Populasi: 3.146 / km²| Lokasi | Populasi | Area | Kepadatan penduduk |
|---|---|---|---|
| Kishiwada, Prefektur Osaka | 227.322 | 72,2 km² | 3.146 / km² |
| Prefektur Osaka | 8,7 juta | 1.902 km² | 4.581 / km² |
| Jepang | 122,9 juta | 373.410,9 km² | 329,2 / km² |
Proyeksi dan Sejarah Populasi Kishiwada, Prefektur Osaka
Perkiraan Populasi dari 1300 hingga 2100Sources:
1. JRC (European Commission's Joint Research Centre) work on the GHS built-up grid
2. CIESIN (Center for International Earth Science Information Network)
3. [Link] Klein Goldewijk, K., Beusen, A., Doelman, J., and Stehfest, E.: Anthropogenic land use estimates for the Holocene – HYDE 3.2, Earth Syst. Sci. Data, 9, 927–953, https://doi.org/10.5194/essd-9-927-2017, 2017.
Distribusi bisnis berdasarkan harga untuk Kishiwada, Prefektur Osaka
Menengah: 67,3%
Tidak mahal: 28,7%
Mahal: 3,4%
Sangat Mahal: 0,6%
Indeks Pembangunan Manusia (IPM)
Indeks komposit statistik dari harapan hidup, pendidikan, dan pendapatan per kapita.Sources: [Link] Kummu, M., Taka, M. & Guillaume, J. Gridded global datasets for Gross Domestic Product and Human Development Index over 1990–2015. Sci Data 5, 180004 (2018) doi:10.1038/sdata.2018.4
Emisi CO2 Kishiwada, Prefektur Osaka
Emisi Karbon Dioksida (CO2) Per Kapita dalam Ton Per Tahun| Lokasi | Emisi CO2 | Emisi CO2 Per Kapita | Intensitas Emisi CO2 |
|---|---|---|---|
| Kishiwada, Prefektur Osaka | 714.374 tn AS | 3,14 tn AS | 9.888 ton AS/km² |
| Prefektur Osaka | 33.067.315 tn AS | 3,79 tn AS | 17.385 ton AS/km² |
| Jepang | 541.995.101 tn AS | 4,41 tn AS | 1.451 ton AS/km² |
Emisi CO2 Kishiwada, Prefektur Osaka
| Emisi CO2 2013 (ton/tahun) | 714.374 tn AS |
| Emisi CO@ 2013 (ton/tahun) per kapita | 3,14 tn AS |
| Intensitas Emisi CO2 2013 (ton/km²/tahun) | 9.888 ton AS/km² |
Risiko Bencana Alam
Risiko relatif dari 10| Topan | (10) Tinggi |
| Banjir | (7) Tinggi |
| Gempa bumi | (8) Tinggi |
* Risiko, terutama yang menyangkut banjir atau tanah longsor, mungkin tidak untuk seluruh area.
Sources: 1. Dilley, M., R.S. Chen, U. Deichmann, A.L. Lerner-Lam, M. Arnold, J. Agwe, P. Buys, O. Kjekstad, B. Lyon, and G. Yetman. 2005. Natural Disaster Hotspots: A Global Risk Analysis. Washington, D.C.: World Bank. https://doi.org/10.1596/0-8213-5930-4.
2. Center for Hazards and Risk Research - CHRR - Columbia University, Center for International Earth Science Information Network - CIESIN - Columbia University. 2005. Global Earthquake Hazard Distribution - Peak Ground Acceleration. Palisades, NY: NASA Socioeconomic Data and Applications Center (SEDAC). https://doi.org/10.7927/H4BZ63ZS.
3. Center for Hazards and Risk Research - CHRR - Columbia University, Center for International Earth Science Information Network - CIESIN - Columbia University, International Bank for Reconstruction and Development - The World Bank, and United Nations Environment Programme Global Resource Information Database Geneva - UNEP/GRID-Geneva. 2005. Global Cyclone Hazard Frequency and Distribution. Palisades, NY: NASA Socioeconomic Data and Applications Center (SEDAC). https://doi.org/10.7927/H4CZ353K.
4. Center for Hazards and Risk Research - CHRR - Columbia University, Center for International Earth Science Information Network - CIESIN - Columbia University. 2005. Global Flood Hazard Frequency and Distribution. Palisades, NY: NASA Socioeconomic Data and Applications Center (SEDAC). https://doi.org/10.7927/H4668B3D.
Gempa Bumi Terdekat Terdekat
Magnitude 3.0 dan lebih tinggi| Tanggal | Waktu | Besarnya | Jarak | Kedalaman | Lokasi | Link |
|---|---|---|---|---|---|---|
| 17/11/14 | 13.07 | 4,3 | 30,8 km | 14.540 m | 8km ESE of Akashi, Japan | usgs.gov |
| 11/11/14 | 17.13 | 4,6 | 31,9 km | 62.380 m | 5km NNW of Koya, Japan | usgs.gov |
| 16/07/13 | 20.07 | 4,4 | 36,2 km | 59.400 m | near the south coast of western Honshu, Japan | usgs.gov |
| 17/03/13 | 08.21 | 4,2 | 42,6 km | 73.800 m | 17km SW of Koya, Japan | usgs.gov |
| 15/09/11 | 15.15 | 4,5 | 39,6 km | 53.400 m | near the south coast of western Honshu, Japan | usgs.gov |
| 10/05/11 | 07.01 | 4,2 | 41,3 km | 23.200 m | near the south coast of western Honshu, Japan | usgs.gov |
| 20/07/10 | 14.19 | 4,9 | 25,7 km | 66.100 m | near the south coast of western Honshu, Japan | usgs.gov |
| 05/08/08 | 14.26 | 4,2 | 42,1 km | 28.500 m | near the south coast of western Honshu, Japan | usgs.gov |
| 16/04/08 | 08.58 | 4,2 | 26,8 km | 55.800 m | near the south coast of western Honshu, Japan | usgs.gov |
| 01/02/08 | 06.40 | 3,4 | 39 km | 10.100 m | near the south coast of western Honshu, Japan | usgs.gov |
Temukan gempa bersejarah yang terjadi di dekat Kishiwada, Prefektur Osaka
Tanggal Terlambat Kencan terakhir
Magnitude 3.0 dan lebih tinggi Besarnya 4.0 dan lebih besar Besarnya 5,0 dan lebih besar
Tentang Data Kami
Data pada halaman ini diperkirakan menggunakan sejumlah alat dan sumber daya yang tersedia untuk umum. Ini diberikan tanpa jaminan, dan dapat mengandung ketidakakuratan. Gunakan dengan risiko Anda sendiri. Lihat di sini untuk informasi lebih lanjut.