- Dunia
- »
- GB
- »
- Inggris
- »
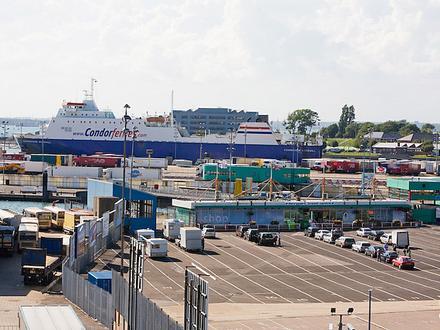
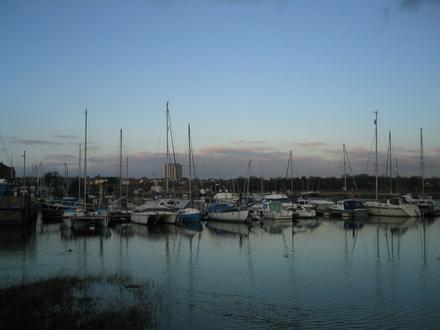
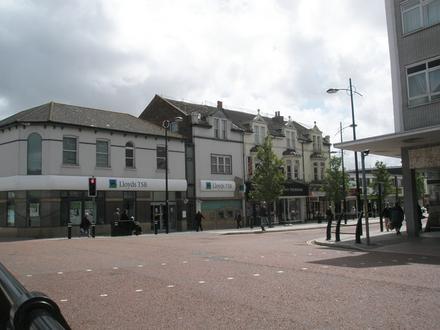
- Gosport, Inggris
Bisnis di Gosport
Hotel & Wisata
Restoran
Otomotif
Layanan Keuangan
Medis
Kecantikan & Spa
Komunitas & Pemerintah
Industri
Distribusi Bisnis berdasarkan Industri Belanja: 17,4%
Layanan Rumah: 14,2%
Layanan Profesional: 11,5%
Industri: 10%
Layanan Setempat: 6,2%
Makanan: 5,7%
Medis: 5,7%
Otomotif: 5%
Lainnya: 24,2%
| Area Gosport, Inggris | 25,3 km² |
| Populasi | 84.764 |
| Populasi Pria | 41.793 (49,3%) |
| Populasi Wanita | 42.971 (50,7%) |
| Populasi berubah dari 1975 hingga 2015 | +19,4% |
| Populasi berubah dari 2000 hingga 2015 | +10,9% |
| Usia Rata-rata | 40,3 |
| Usia Rata-rata Pria | 39,1 |
| Usia Rata-rata Wanita | 41,4 |
| Sekitarnya | City Centre, Gosport, Gunwharf Quays, Town Centre |
| Waktu Setempat | Sabtu 17.50 |
| Zona Waktu | Waktu Musim Panas Inggris |
| Grs Lintang & Grs Bujur | 50.79509° / -1.12902° |
| Kode Pos | PO12, PO13 |
Gosport, Inggris - Peta
Populasi Gosport, Inggris
Tahun 1975 hingga 2015| Data | 1975 | 1990 | 2000 | 2015 |
|---|---|---|---|---|
| Populasi | 70.979 | 73.507 | 76.459 | 84.764 |
| Kepadatan penduduk | 2.806 / km² | 2.906 / km² | 3.023 / km² | 3.351 / km² |
Populasi Gosport berubah dari 2000 hingga 2015
Peningkatan 10,9% dari tahun 2000 hingga 2015| Lokasi | Berubah sejak 1975 | Berubah sejak 1990 | Berubah sejak 2000 |
|---|---|---|---|
| Gosport, Inggris | +19,4% | +15,3% | +10,9% |
| Hampshire | +14,3% | +12,3% | +9,2% |
| Britania Raya | +15,2% | +13,3% | +9,9% |
Usia Median Gosport, Inggris
Usia Median: 40,3 tahun| Lokasi | Usia Rata-rata | Usia Median (Wanita) | Usia rata-rata (Pria) |
|---|---|---|---|
| Gosport, Inggris | 40,3 tahun | 41,4 tahun | 39,1 tahun |
| Hampshire | 40,3 tahun | 41,3 tahun | 39,2 tahun |
| Britania Raya | 39,6 tahun | 40,6 tahun | 38,5 tahun |
Pohon Populasi Gosport, Inggris
Penduduk Menurut Umur dan Jenis Kelamin| Usia | Pria | Wanita | Total |
|---|---|---|---|
| Di bawah 5 | 2.879 | 2.639 | 5.518 |
| 5-9 | 2.503 | 2.285 | 4.789 |
| 10-14 | 2.582 | 2.446 | 5.028 |
| 15-19 | 2.663 | 2.573 | 5.236 |
| 20-24 | 2.605 | 2.561 | 5.166 |
| 25-29 | 2.837 | 2.738 | 5.575 |
| 30-34 | 2.601 | 2.512 | 5.114 |
| 35-39 | 2.690 | 2.846 | 5.537 |
| 40-44 | 2.961 | 3.110 | 6.072 |
| 45-49 | 3.149 | 3.172 | 6.322 |
| 50-54 | 2.998 | 2.825 | 5.823 |
| 55-59 | 2.315 | 2.405 | 4.721 |
| 60-64 | 2.620 | 2.685 | 5.306 |
| 65-69 | 1.953 | 2.127 | 4.081 |
| 70-74 | 1.600 | 1.736 | 3.337 |
| 75-79 | 1.278 | 1.665 | 2.944 |
| 80-84 | 874 | 1.243 | 2.118 |
| 85 Plus | 684 | 1.402 | 2.087 |
Kepadatan Populasi Gosport, Inggris
Kepadatan Populasi: 3.351 / km²| Lokasi | Populasi | Area | Kepadatan penduduk |
|---|---|---|---|
| Gosport, Inggris | 84.764 | 25,3 km² | 3.351 / km² |
| Hampshire | 1,8 juta | 3.856,9 km² | 466,1 / km² |
| Britania Raya | 64,5 juta | 247.916,6 km² | 260,3 / km² |
Proyeksi dan Sejarah Populasi Gosport, Inggris
Perkiraan Populasi dari 1750 hingga 2100Sources:
1. JRC (European Commission's Joint Research Centre) work on the GHS built-up grid
2. CIESIN (Center for International Earth Science Information Network)
3. [Link] Klein Goldewijk, K., Beusen, A., Doelman, J., and Stehfest, E.: Anthropogenic land use estimates for the Holocene – HYDE 3.2, Earth Syst. Sci. Data, 9, 927–953, https://doi.org/10.5194/essd-9-927-2017, 2017.
Kode Area
Persentase Kode Area yang digunakan oleh bisnis dalam Gosport Kode Area 23: 64%
Kode Area 1329: 11%
Kode Area 77: 7%
Kode Area 79: 6,2%
Kode Area 78: 5,9%
Lainnya: 5,9%
Distribusi bisnis berdasarkan harga untuk Gosport, Inggris
Tidak mahal: 60,5%
Menengah: 33,7%
Sangat Mahal: 3,9%
Mahal: 2%
Indeks Pembangunan Manusia (IPM)
Indeks komposit statistik dari harapan hidup, pendidikan, dan pendapatan per kapita.Sources: [Link] Kummu, M., Taka, M. & Guillaume, J. Gridded global datasets for Gross Domestic Product and Human Development Index over 1990–2015. Sci Data 5, 180004 (2018) doi:10.1038/sdata.2018.4
Emisi CO2 Gosport, Inggris
Emisi Karbon Dioksida (CO2) Per Kapita dalam Ton Per Tahun| Lokasi | Emisi CO2 | Emisi CO2 Per Kapita | Intensitas Emisi CO2 |
|---|---|---|---|
| Gosport, Inggris | 1.013.697 tn AS | 12 tn AS | 40.082 ton AS/km² |
| Hampshire | 23.394.807 tn AS | 13 tn AS | 6.065 ton AS/km² |
| Britania Raya | 735.672.543 tn AS | 11,4 tn AS | 2.967 ton AS/km² |
Emisi CO2 Gosport, Inggris
| Emisi CO2 2013 (ton/tahun) | 1.013.697 tn AS |
| Emisi CO@ 2013 (ton/tahun) per kapita | 12 tn AS |
| Intensitas Emisi CO2 2013 (ton/km²/tahun) | 40.082 ton AS/km² |
Risiko Bencana Alam
Risiko relatif dari 10| Banjir | (7) Tinggi |
* Risiko, terutama yang menyangkut banjir atau tanah longsor, mungkin tidak untuk seluruh area.
Sources: 1. Dilley, M., R.S. Chen, U. Deichmann, A.L. Lerner-Lam, M. Arnold, J. Agwe, P. Buys, O. Kjekstad, B. Lyon, and G. Yetman. 2005. Natural Disaster Hotspots: A Global Risk Analysis. Washington, D.C.: World Bank. https://doi.org/10.1596/0-8213-5930-4.
2. Center for Hazards and Risk Research - CHRR - Columbia University, Center for International Earth Science Information Network - CIESIN - Columbia University. 2005. Global Flood Hazard Frequency and Distribution. Palisades, NY: NASA Socioeconomic Data and Applications Center (SEDAC). https://doi.org/10.7927/H4668B3D.
Gempa Bumi Terdekat Terdekat
Magnitude 3.0 dan lebih tinggi| Tanggal | Waktu | Besarnya | Jarak | Kedalaman | Lokasi | Link |
|---|---|---|---|---|---|---|
| 26/02/19 | 19.42 | 3,3 | 74,5 km | 10.000 m | 3km SE of Dorking, United Kingdom | usgs.gov |
| 13/07/11 | 23.59 | 3,9 | 79,7 km | 10.000 m | England, United Kingdom | usgs.gov |
| 09/09/95 | 11.20 | 3,3 | 17,7 km | 10.000 m | England, United Kingdom | usgs.gov |
| 02/12/85 | 09.40 | 3,3 | 49 km | 13.000 m | England, United Kingdom | usgs.gov |
Kode Pos
Persentase bisnis oleh Kode Pos di Gosport Kode Pos PO12: 75%
Kode Pos PO13: 23,2%
Lainnya: 1,7%
Tentang Data Kami
Data pada halaman ini diperkirakan menggunakan sejumlah alat dan sumber daya yang tersedia untuk umum. Ini diberikan tanpa jaminan, dan dapat mengandung ketidakakuratan. Gunakan dengan risiko Anda sendiri. Lihat di sini untuk informasi lebih lanjut.